A tale of two bills (September 15, 2015)
Comparing two recent utility bills from TOAV, and contrasting those with recent bills from AVRWC.
Note the huge increase in cost despite there being no added benefit to the homeowner.
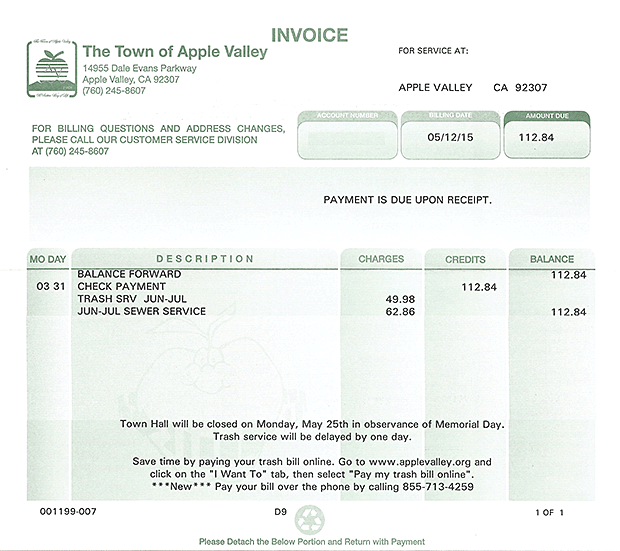
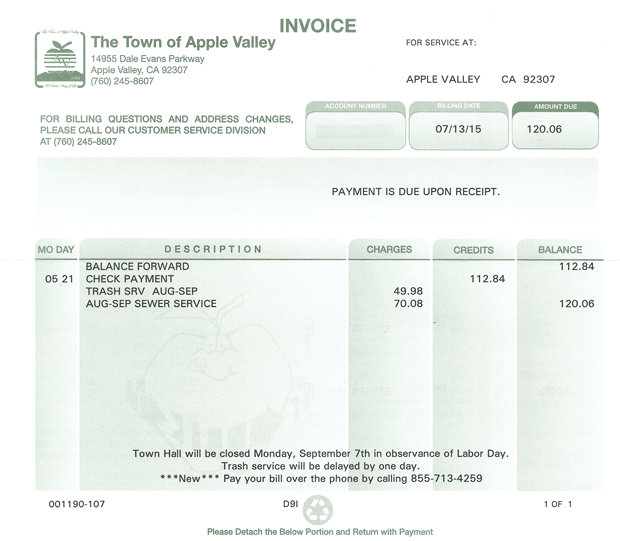
The Town of Apple Valley claims this is a $4.00 increase, failing to note that this increase is per month, not per bill.
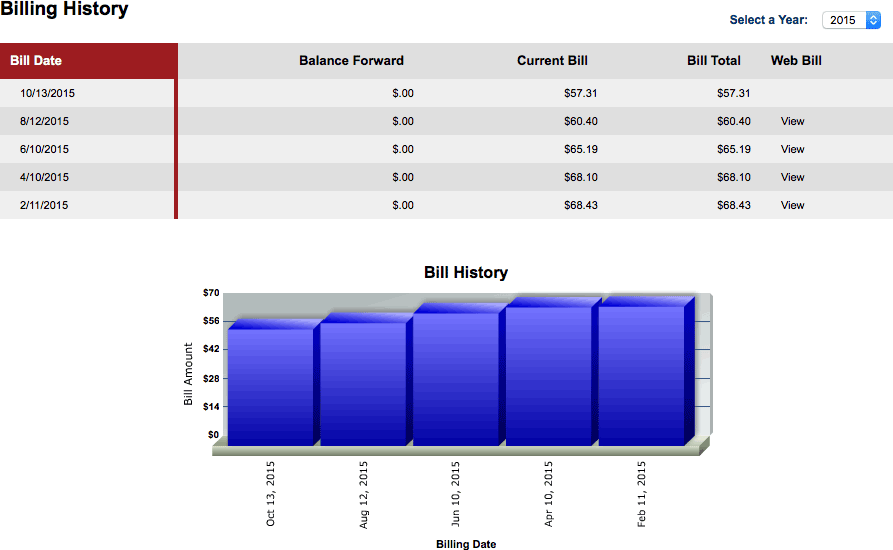
Compare this to the last tenth months (five billing cycles) of water bills for this same address, which shows the homeowner can control the amount of the bill by reducing water usage.
| Year | Feb | Apr | Jun | Aug | Oct | Dec |
|---|---|---|---|---|---|---|
| 2005 | $54.21 | $57.98 | $56.52 | $56.52 | $51.60 | $50.06 |
| 2006 | $57.59 | $54.74 | $62.39 | $65.39 | $65.35 | $57.71 |
| 2007 | $46.24 | $71.89 | $64.21 | $70.43 | $62.74 | $48.88 |
| 2008 | $63.34 | $57.61 | $62.30 | $63.85 | $65.42 | $56.05 |
| 2009 | $58.36 | $58.94 | $67.15 | $69.20 | $63.76 | $59.97 |
| 2010 | $59.42 | $60.37 | $67.99 | $85.85 | $76.87 | $64.40 |
| 2011 | $63.00 | $65.51 | $73.30 | $76.50 | $71.36 | $58.41 |
| 2012 | $64.37 | $62.52 | $71.96 | $80.21 | $68.02 | $71.43 |
| 2013 | $66.16 | $76.38 | $93.70 | $84.57 | $87.07 | $71.33 |
| 2014 | $71.06 | $71.36 | $79.71 | $81.23 | $69.60 | $69.10 |
| 2015 | $68.43 | $68.10 | $65.19 | $60.40 | $57.31 | $57.38 |
| 2016 | $56.50 | $58.72 | $58.93 | $65.00 | $60.17 | $55.32 |
| 2017 | $61.50 | $62.49 | $71.56 | $66.77 | $66.77 | $66.77 |
| 2018 | $65.37 | $63.84 | $64.03 | $64.31 | $66.94 | $66.94 |
| 2019 | $62.85 | $66.83 | $70.92 | $69.46 | $68.71 | $60.30 |
| 2020 | $60.17 | $41.94 | $60.17 | $67.76 | $64.09 | $60.87 |
| 2021 | $73.17 | $62.81 | $70.38 | $68.67 | $65.45 | $40.25 |
— Greg Raven is Co-Chair of Apple Valley Citizens for Government Accountability, and is concerned about quality of life issues.